For knowledge sharing club - 4/26/25
We experience time linearly, moving forward. Therefore, we collect a lot of time domain (time series) data - but frequently (no pun intended) it’s useful to see that from a different perspective - in the frequency domain.
Frequency domain visualization can be really useful for extracting insights from a wave like above. Signals like the above show periodicity, but it may not be apparent exactly what the characteristics of that periodicity are. In the interactive above, looking at the purple wave, it’s not immediately obvious what primitive sine waves compose it.
This is a good visual representation of what we’re trying to do:
.gif)
(source: Wikipedia)
How do we go from time to frequency? This is the question that the fourier transform aims to answer. It’s defined below:
What do each of these terms mean?
- is the frequency domain representation
- is the time domain representation
- is the complex exponential that we use to correlate our timeseries signal with
Ok, so this is a start - we have an integral across the entire function where we multiple our signal by this complex exponential - but this just moves our confusion to this complex exponential. Let’s try to intuitively understand this.
From school, you may recall Euler’s identity:
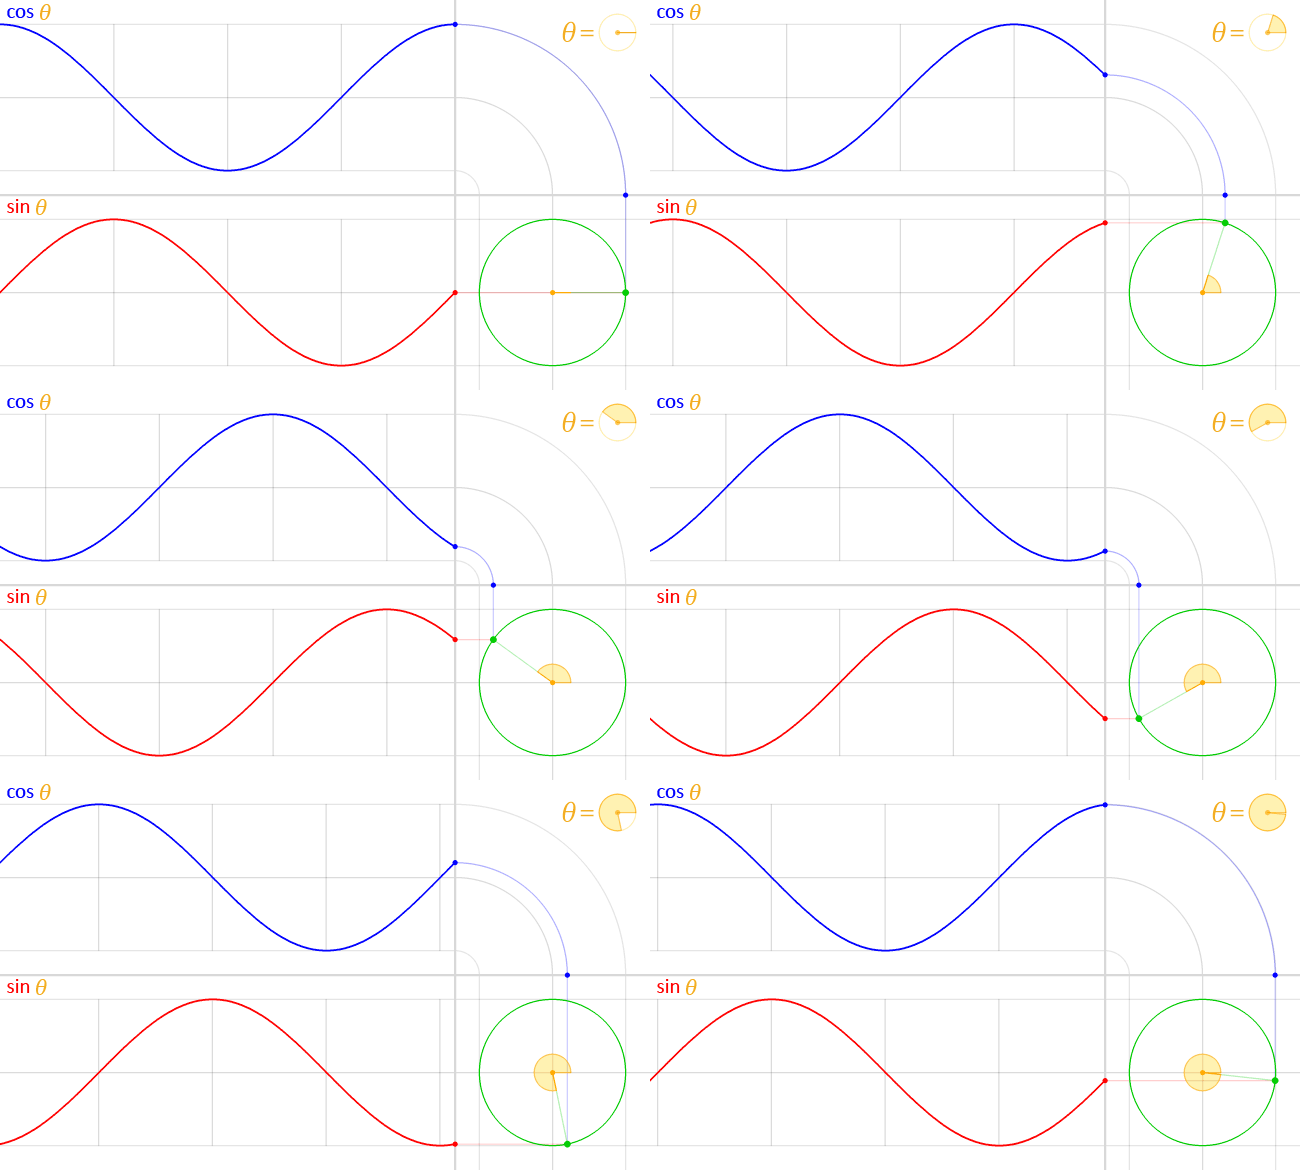
so for any given frequency, what we’re doing is multiplying our function by a sin and cosine function. Why do we do this?

(source Wikipedia)
Sin and cosine is that they can be seen as the fundamental periodic functions - when we multiply our function by a sin + cos wave at a certain frequency, we get a complex value that (once we take the magnitude of it), gives us the “power” of the time signal at that frequency. This is the computation that this function describes at a single frequency.
So how do we use this practically? We can’t exactly integrate across infinity for each frequency, can we? This is where the DFT comes in.
The DFT, or Discrete Fourier Transform, is defined below:
This is just a discretization of the standard FT, with being the sample rate (and length of all arrays):
- integral → summation
- continuous function in frequency domain → discrete points in frequency domain
- continuous function in time domain → discrete, sampled points in the time domain
- continuous complex exponential in time domain → discrete, complex points from a complex exponential
Essentially, this can be understood as a bunch of element wise multiplications, and a sum across all of those - essentially just a dot product
Where is the complex exponential vector for a single frequency , and is the vector representing the points
But what is a series of dot products if not just a matrix equation:
where is the vector of points representing , and
Turns out the DFT is just a simple matrix multiplication! This matrix , is called the Fourier Matrix, and boils down the essence of the Fourier transform into a simple form.
Future topics
- FFT and the optimization of the DFT
- Cooley-Tukey Algorithm + symmetries in Fourier Matrix
- Other types of transforms and their uses
- laplace transform (control systems, periodicity + decay)
- wavelet transform (analyzing frequencies over time)
- number theoretic transform (fast integer multiplication)
- Multiplication / Convolution Theorem
- Considerations for using FFT/DFT (artifacts from sampling, usable data, etc)